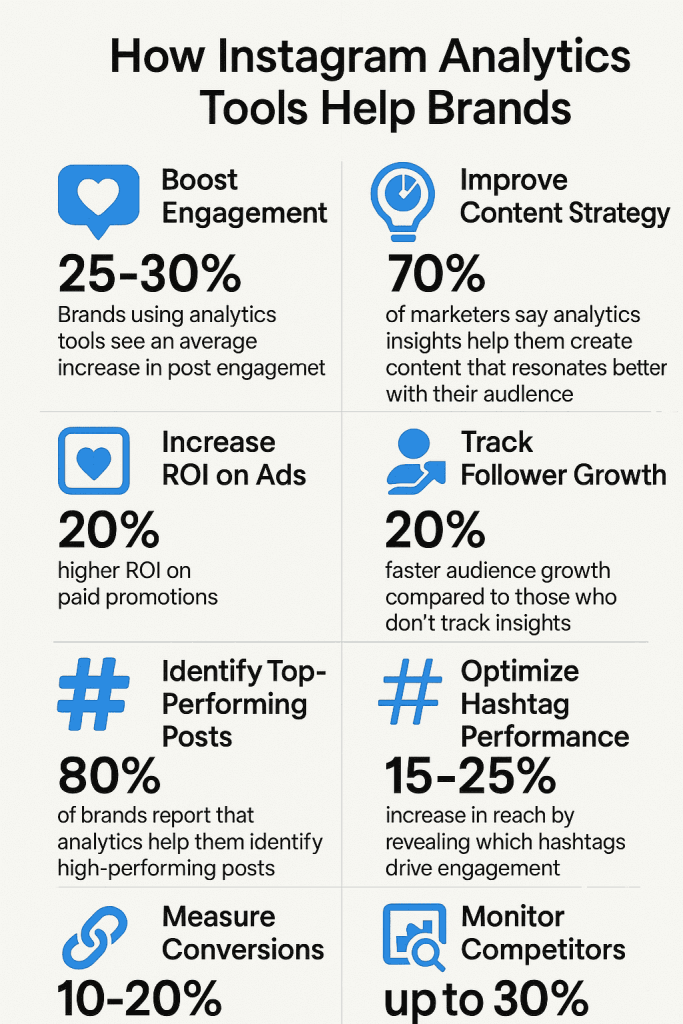
Instagram is no longer just a social app, in 2025 it’s evolving into a searchable, indexable content platform, meaning your visual posts can pull traffic beyond the app itself. As such, the role of analytics now spans not only performance tracking but also content optimization for discovery.
Analytics help you move from guesswork (“Which post did well?”) to insight-driven strategy: identifying what content resonates, optimizing posting times, understanding your audience, and aligning with business goals. This guide will walk you through the metrics that matter, tools to use, how to choose the right one, and how to turn data into action.
What Are Instagram Analytic Tools — Then vs. Now
Instagram analytic tools are platforms (native or third-party) that collect, display, analyze, and visualize data about your Instagram account performance: content engagement, audience behavior, reach, conversions, etc.
Evolution in 2025
- In earlier years, metrics like impressions and plays were common. In 2025, views have become the unified baseline metric across formats (Posts, Reels, Stories).
- Newer analytics dive deeper: slides within carousels, story exit/completion, follower attribution per post, DM shares, etc.
- Native tools often retain only ~90 days of history — making third-party tools necessary for long-term trend tracking.
- Because Instagram content can now be indexed (for public Business / Creator accounts), analytics increasingly intersect with SEO and content discovery.

Key Metrics That Matter in 2025
Here’s what you should track, and why in 2025:
Views (Unified metric)
- Replaces plays/impressions in many cases — it’s the default baseline across formats.
- Use views to normalize cross-format comparisons (Reels vs Posts vs Stories).
Engagement & Interaction
- Likes, comments, saves — still core signals.
- Shares / Send / DM forwarding — increasingly important for reach.
- Replies / sticker taps in Stories.
- Carousel-level detail: which slide got the most engagement.
Completion & Retention (for video / Reels / Stories)
- Watch-to-End / Completion rate (how many viewers saw the full content).
- Drop-off points: useful to know where viewers lose interest.
Reach & Unique Accounts
- How many unique accounts saw the content.
- Follower vs non-follower reach.
Follower Growth & Attribution
- Net gain / loss over time.
- Which posts or campaigns drove new followers (post-level attribution).
Demographics & Behavior
- Age, gender, location, language.
- Active times (when your audience is online).
- Audience overlap (for brands with multiple accounts).
Clicks, Website Traffic & Conversion Metrics
- Link clicks (profile, story, post CTAs).
- UTM tracking & attribution (tie Instagram to website actions).
- Conversion metrics (if connected to e-commerce / landing pages).
Benchmarking & Competitor Analytics
- Compare your metrics vs peers or competitors.
- Track content gaps, growth pace, engagement norms.
Historical Trends & Forecasting
- Month-on-month, quarter-on-quarter comparisons.
- Trend detection and anomaly alerts.
The SEO / SERP Angle on Instagram Analytics
Because public Instagram posts (for Business / Creator accounts) can now be crawled and indexed, there’s a strategic overlap between social analytics and SEO.
- Caption & alt-text optimization: Tools that help you analyze which captions, hashtags or alt texts attract visibility can indirectly boost your search footprint.
- Keyword / Topic insight: Analytics that detect trending topics or hashtag affinities can help you craft content that aligns with what gets indexed or surfaced.
- Structured data & featured snippets: Use your analytics data to identify content worthy of snippets or “What People Are Saying” modules (quotes, stats).
- Internal linking & cross-posting: Analytics help select which posts are strong candidates to link from your blog or embed — driving internal SEO value.
- Archive & content resurfacing: Trend-based analytics tell you which old posts to repurpose or update (especially ones that might rank).
Best Instagram Analytic Tools in 2025
Here’s a comparative list of popular tools, their strengths, use-cases, and what to watch for:
| Tool | Strengths / Key Features | Ideal For | Considerations / Weaknesses |
|---|---|---|---|
| Instagram Insights (Native) | Free, built-in; shows engagement, reach, demographics | Small businesses, new creators | 90-day data only; no white-label reports or cross-platform benchmarking |
| Sprout Social | Deep analytics + competitor reports + social listening across platforms | Agencies, brands managing multiple platforms | Costly; steeper learning curve |
| Vista Social | All-in-one: scheduling, analytics, reporting, export, cross-platform support | Agencies, brands wanting consolidation | Feature set may be more than needed for solo creators |
| Iconosquare | Detailed IG (and multi-platform) analytics, hashtag tools | Mid-sized brands, agencies | May be overkill for beginners |
| Later | Simplified UI + analytics + best time suggestions | Creators, small brands | Analytics not as deep as dedicated tools |
| Buffer Analyze | Clean dashboards, ideal for small teams | Solo marketers or small agencies | Simpler reporting features |
| Agorapulse | Combines publishing + analytics + user workflows | Teams needing integrated tool | Might lack hyper granularity |
| Social Status | Focused reporting, deep metrics + white-label export | Agencies & analytic-heavy users | Limited data retention in lower plans |
| Sendible | White-labeling, modular analytics, cross-platform | Agencies servicing clients | UI complexity; steep for beginners |
| Keyhole | Hashtag & campaign tracking, real-time insights | Influencer marketing, campaigns | Can be pricey for heavy users |
How to Choose the Right Tool
- Define your goals (awareness, conversions, influencer marketing, etc.).
- Decide if you need deep data or a simple dashboard.
- Check if it supports cross-platform reports.
- Look at data retention — does it go beyond Instagram’s 90-day cap?
- Consider exporting and white-label needs for agencies.
- Evaluate pricing and scalability.
- Ensure usability fits your workflow.
- Look for SEO alignment features.
From Data to Strategy: Actionable Tips
- Set a reporting cadence: weekly for anomalies, monthly for patterns, quarterly for pivots.
- Use funnels (views > engagement > saves > conversions) to spot drop-offs.
- Test creative variations (hooks, thumbnails, formats).
- Refine posting schedules using active-time analytics.
- Benchmark competitors and uncover gaps.
- Use UTM links to measure Instagram’s impact on web traffic.
- Archive and compare long-term trends.
- Prioritize meaningful signals like saves and shares over vanity metrics.
Challenges & Limitations
- Native tools only store ~90 days of data.
- Metric definitions differ between platforms.
- API changes can disrupt third-party tools.
- Some features are restricted to public Business/Creator accounts.
- Over-relying on data may stifle creative risk-taking.
Future Trends to Watch
- AI-driven anomaly detection and predictive analytics.
- Cross-platform correlation (Instagram + TikTok + YouTube).
- Auto-optimization features (caption suggestions, posting time predictions).
- Deeper SEO integration as Instagram content gets indexed.
- Better attribution for influencer and UGC campaigns.
Conclusion
Instagram analytic tools in 2025 are more than reporting dashboards — they’re decision-making engines. With Instagram content becoming discoverable through search, analytics now help with both audience engagement and SEO strategy.
Start by clarifying your goals, test a couple of tools in parallel, and focus on the insights that drive meaningful outcomes. Use data as a guide, not a crutch, and you’ll keep your strategy sharp as Instagram continues to evolve.

